Phoenix CollegeDepartment of MicroscopyContact Dr. Ong
THE ADVANCED MICROSCOPY FIELD GUIDE

Find the signal.
See the story.

A practical guide to selecting a method, preparing a specimen, and reading an image without losing the science behind it.

Compare the methods

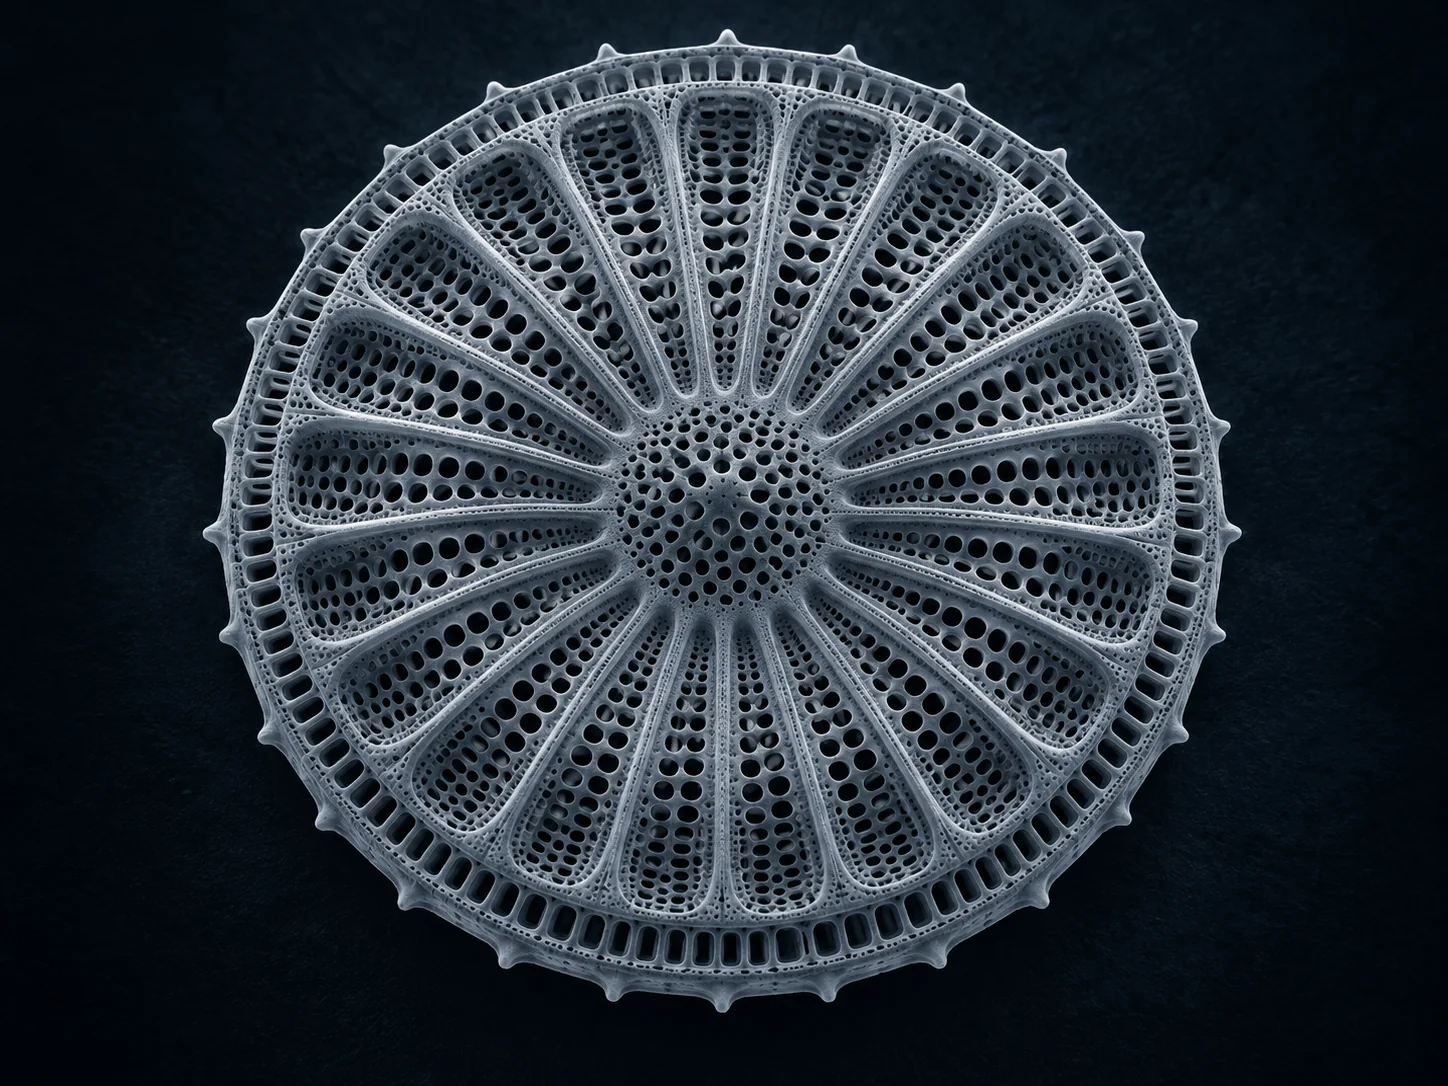
Illustrative SEM-inspired diatom visualization; not acquired specimen data.

Every image is
a measurement.

An image is shaped by the signal, the sample, the instrument settings, and the choices made during analysis.

Electron beams, fluorescent light, polarized light, and scanning probes reveal different properties. A sharp-looking picture is not enough: interpretation depends on scale, contrast mechanism, preparation, and controls.

Match the method
to the question.

Start with what you need to learn from the specimen. The method then follows from the signal that can answer it.

Swipe the table horizontally to compare all four columns.

What common advanced microscopy methods reveal and where caution is needed
MethodPrimary signalUseful forInterpretation caution
Scanning electron microscopyEmitted or backscattered electronsFine surface form and composition-related contrastCharging, coating, and preparation can change what appears.
Atomic force microscopyTip–sample forceSurface topography and local physical propertiesProbe shape and scan settings can produce artifacts.
Fluorescence & confocalLight emitted by fluorophoresLabeled structures and optical sections in thicker specimensPhotobleaching and labeling choices affect the result.
Polarized lightChanges in polarized lightBirefringent materials, crystal orientation, and textureColor depends on thickness and optical orientation.

These are general principles, not a list of currently available instruments at Phoenix College. Ask Dr. Ong about current access.

Illustrative scanning electron microscopy inspired view of a porous diatom shellARTISTIC VISUALIZATION · NO SCALE IMPLIED

Scanning electron
microscopy.

SEM raster-scans a focused electron beam over a specimen. Detectors translate interactions into a map of fine features.

Secondary electrons emphasize surface detail; backscattered electrons can show differences related to composition. The specimen and beam conditions determine what can be resolved and interpreted.

AskWhat is the surface shape or texture?
CheckScale calibration, charging, coating, and imaging conditions.
RememberContrast is a signal response, not automatically a chemical identification.

Explore SEM signals at NIST ↗

Atomic force
microscopy.

AFM senses the interaction between a sharp tip and a surface as the tip scans across it.

Cantilever motion is converted into a topographic map. This can reveal details that a conventional optical image cannot, but the probe and scan settings influence the measured shape. Phoenix College reported student exposure to AFM in Dr. Ong’s micro and nanotechnology coursework in 2024.

AskHow does the surface height or local response vary?
CheckProbe condition, scan direction, feedback settings, and repeatability.
Explore the AFM principle ↗
Illustrative fluorescence inspired cells with blue nuclei, cyan filaments, and orange punctaARTISTIC VISUALIZATION · NOT A PC MICROGRAPH

Fluorescence
& confocal.

Fluorophores make selected structures visible by emitting light after excitation.

Confocal systems use a pinhole to reject much of the out-of-focus fluorescence. Acquiring successive focal planes can produce optical sections for studying a thicker specimen. Label specificity, photobleaching, and image processing must be considered when interpreting the result.

AskWhere is a labeled structure within the specimen?
CheckChannel controls, background, exposure, and optical section spacing.
Learn confocal concepts ↗

From illustration
to evidence.

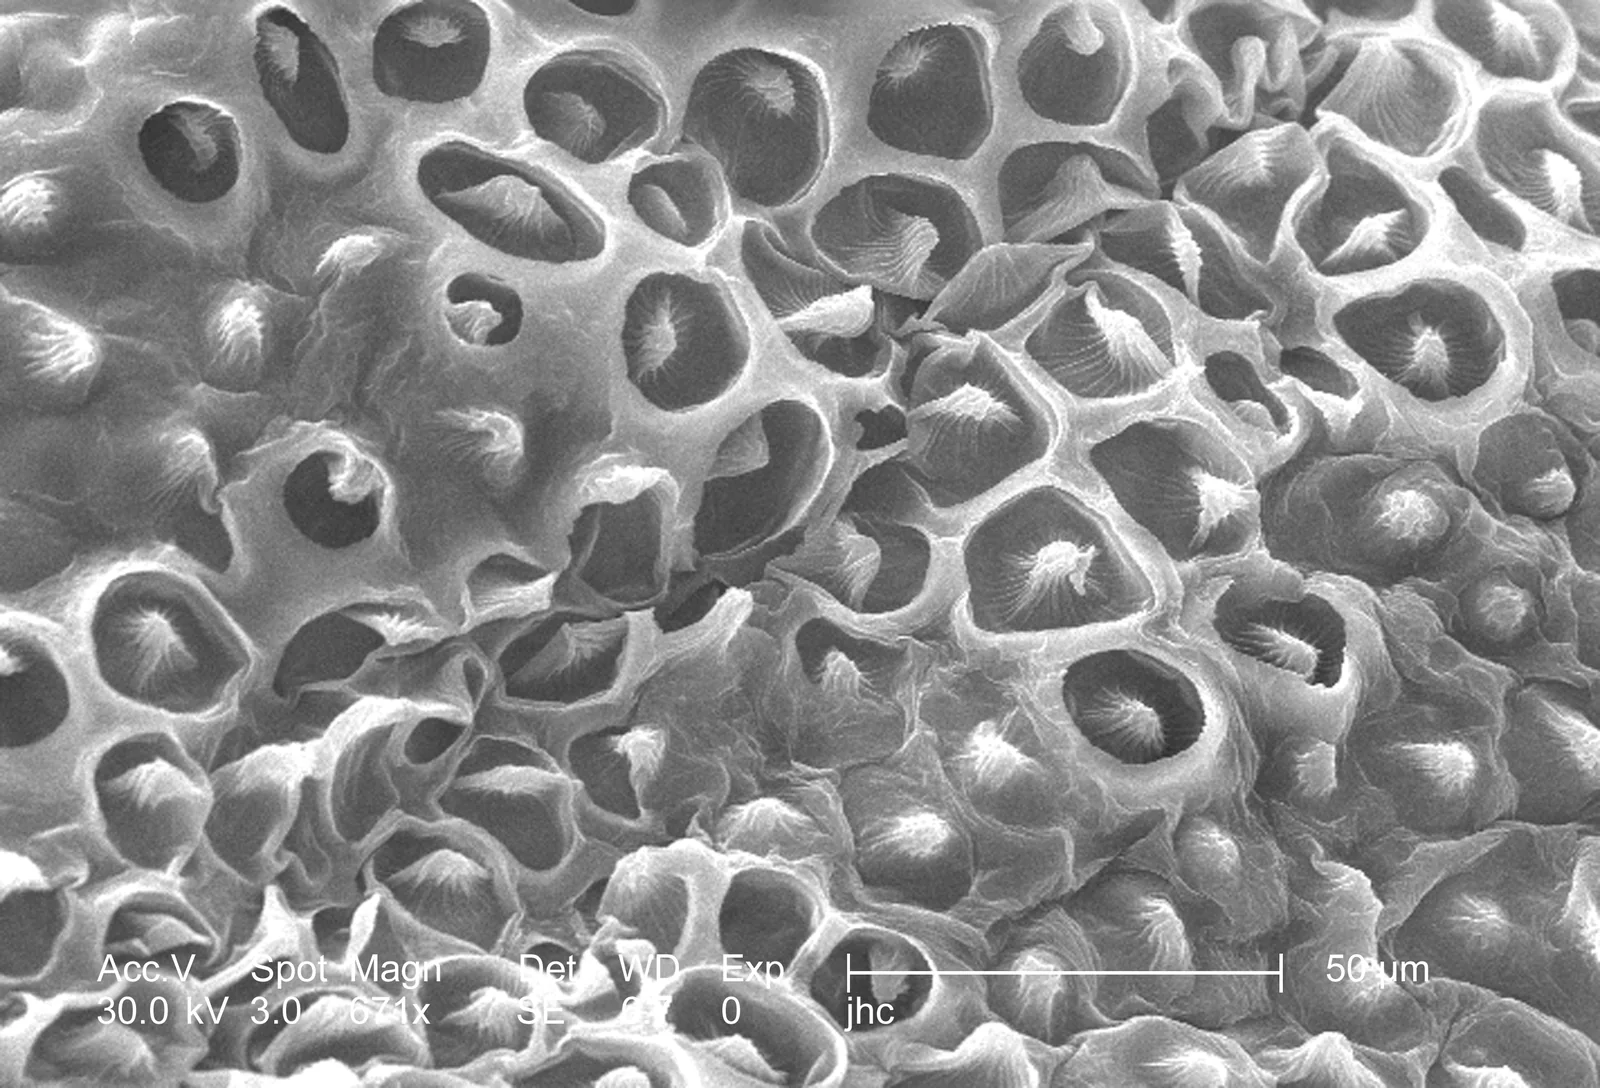
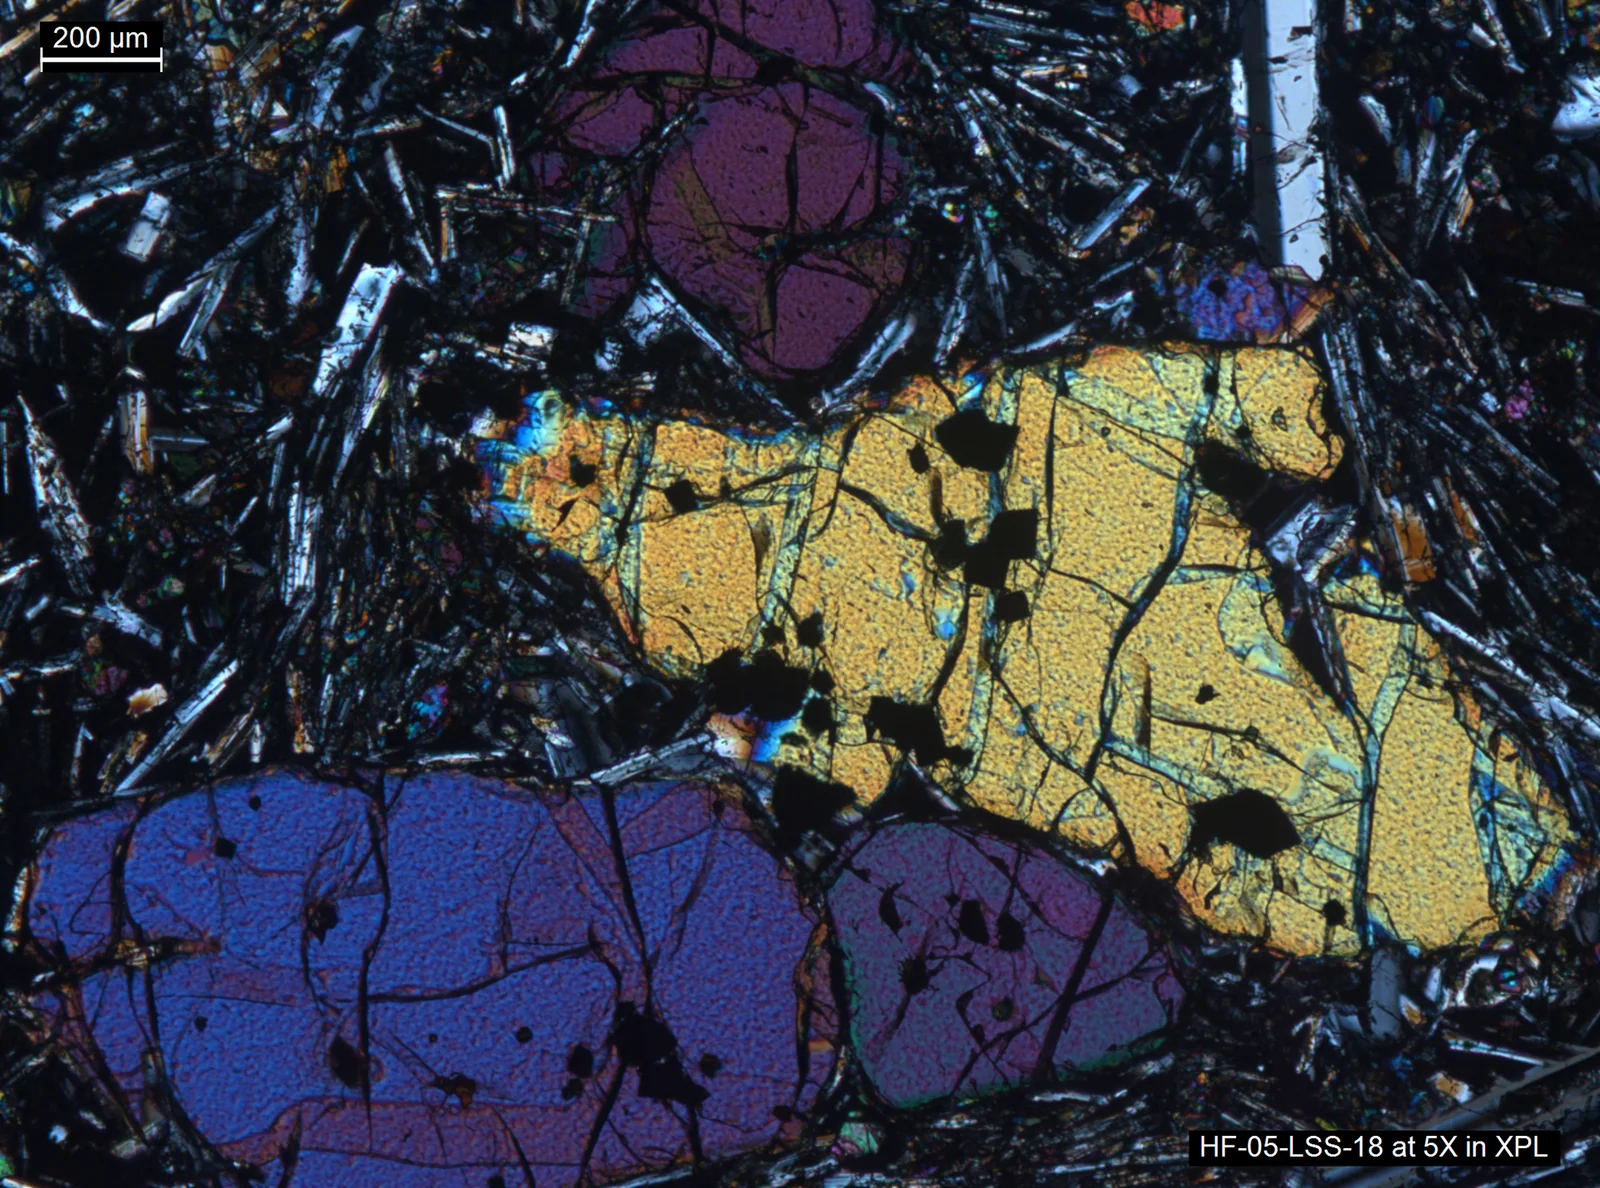
These real micrographs show the kind of data that can be interpreted when the specimen, technique, scale, and source are known.

Grayscale scanning electron micrograph of the textured surface of a crimson clover flower petal, with an embedded 50 micrometer scale bar
SCANNING ELECTRON MICROSCOPYCrimson clover petal surface

671× SEM image. The bottom of the source image carries instrument settings and a 50 μm scale bar.

Credit: CDC / Janice Haney Carr; Betsy Crane is also listed by CDC. Public domain. View source and attribution ↗
Polarized-light micrograph of a Yellowstone lava thin section, with colorful olivine crystals, dark inclusions, and an embedded 200 micrometer scale bar
POLARIZED LIGHT MICROSCOPYYellowstone lava thin section

Olivine phenocrysts sit within a finer plagioclase-rich groundmass. The source image includes a 200 μm scale bar.

Credit: Brandi Lawler, University of Wyoming / USGS. Public domain. View source and attribution ↗

These are external reference specimens, not Phoenix College micrographs. The other microscopy visuals on this site are labeled artistic illustrations.

Make the image
defensible.

Microscopy becomes stronger when the path from specimen to conclusion is recorded. These habits help another person understand what the image shows and what remains uncertain.

  1. 01

    Record acquisition settings

    Keep detector, voltage or illumination, objective or probe, dwell or exposure, and processing details with the image.

  2. 02

    Calibrate the scale

    Use the instrument calibration and preserve a valid scale bar when presenting measured features.

  3. 03

    Look for artifacts

    Check for charging, drift, contamination, photobleaching, and preparation effects before interpreting patterns.

  4. 04

    Compare more than one view

    Replicates, controls, and complementary methods make an interpretation more reliable.

Pair imaging with
characterization.

An image describes spatial structure. Other tools can answer related questions about chemistry and crystal structure. Phoenix College’s 2024 profile described student learning with FTIR and X-ray diffraction alongside microscopy.

FTIR

Infrared spectroscopy

Reads infrared absorption patterns associated with molecular bonds. It adds chemical context rather than a magnified surface image.

XRD

X-ray diffraction

Uses diffraction patterns to investigate crystalline phases and structure. It can complement features seen in an image.

SEM + AFM

Correlative thinking

Compare surface appearance and height information, while accounting for each method’s sample preparation and artifacts.

The college story reports particular student experiences in 2024; it does not establish current equipment availability or a public service menu.

Look beyond
magnification.

Use these questions before you choose a technique or present an image.

Does higher magnification always reveal more detail?

No. Resolution depends on the signal, optics or probe, specimen, and acquisition conditions. Enlarging an image cannot recover detail that was never resolved.

Why can specimen preparation change the result?

Fixation, drying, sectioning, staining, or conductive coating may make imaging possible while also changing appearance. Document the preparation and compare controls when practical.

Is an attractive microscopy image enough for a conclusion?

No. A persuasive result needs a calibrated scale, relevant controls, repeatable observations, and a clear account of what the signal represents.

Which instruments can students use at Phoenix College now?

Availability and training arrangements can change. Contact Dr. Eddie Ong for current information about equipment and opportunities.

HAVE A QUESTION ABOUT CURRENT OPPORTUNITIES?

Start a conversation with Dr. Ong.

Email Dr. Ong